

I talk about politics and history on my blog quite a bit. These are my absolute favorite topics. I have in past posts talked about economics but it tends to be boring. One of my goals when starting this blog was to educate. So in this post, I intend to educate about some economic policies that relatively misunderstood by the general population. I won’t jump into the hardest concept first because in economics similar to math and science you have to understand the basics. First I want to talk about supply and demand. I know that I have talked about it before. Then I want to move into monetary policy. I might even touch on tariffs which I explained here. It occurred to me that President Trump’s recent tariffs have confused many people. You may or may not realize that tariffs can have very serious effects on our economy. They can also affect how other countries treat us. More on these topics later.
Supply and Demand: How it works?
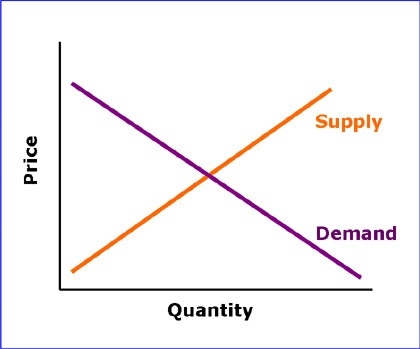
You might be familiar with a chart that looks like this. (Above) The way to read the chart is simple. First, you have to recognize a basic principle in economics that I call “push and pull”. Its very similar to Issac Newton’s “For every action there is a reaction” because for each transaction or movement of money or just action there is a reaction that also involves a transaction or movement of money. Therefore if we look at the orange line labeled as supply and the purple line labeled as demand, you can see horizontal axis is labeled Quantity (increasing from left to right). The vertical axis is labeled Price which is increasing from up to down.
To put it simply:
As the supply goes up, the demand goes down. (Price and Quantity go up as well)
As the demand goes up, the supply goes down. (Price and Quantity go down as well)
This chart is the basis for literally everything in economics. Nearly everything can be put into terms of supply and demand. I will give a simple example of how supply and demand works:
Let’s say you own a winery in Napa Valley, California. Let’s say you have two main competitors that are approximately the same size winery as you. All three wineries make similar profits, have similar expenses and locations.
The going-market value for a 750ml bottle of wine is 25 dollars.
Your company price: 27 dollars, Competitor A: 27 dollars, Competitor B: 27 dollars
So right now every company is above value meaning that supply is meeting demand. Every company is able to charge more because of a high demand. Now Let’s say there is a massive drought. Shortage of grapes. Now you and your competitors can’t make as much wine. What do you think happens to the price?
Your company price: 30 dollars, Competitor A: 31 dollars, Competitor B: 32.
If you said that the price will increase because the supply has been depressed while the demand remained the same then you would be correct. Now let’s say the drought is over but a study comes out that says wine is bad for mental health. Suddenly everyone stops buying wine. What happens to your prices?
Your company price: 23 dollars, Competitor A: 20, Competitor B: 23 dollars.
If you said prices will decrease because of the drop in demand and the excess supply of wine then you would be correct. This is a very simplistic example and obviously running a winery is more complicated than I presented. I think that the concept is clear. For every action there is a reaction. For every push there is a pull.
I hope you got supply and demand down pat, because we are going to use it to help explain why President Trump’s tariffs are not as great as they sound. If you want to check out my post on tariffs then click here. In this next section, I will be focusing specifically on the economics.
The “Dead-weight” Tariffs– Tariffs in the context of supply and demand.
If you went to read my tariff post then you’ll have some idea what I’m about to explain here. For the purpose of this section, I’m going to assume you just learned about supply and demand. Let me explain that tariffs are a tax on an import or export (In this case President Trump is putting tariffs on imports) Tariffs actually used to be the US government’s biggest source of income up until the turn of the 20th century. The US approved an (16th) amendment to constitution that made income tax the primary source of government income. Now a days, tariffs only make up about 1-2 percent of income for the government.
An import is a good or product that is shipped or brought into the country. An export is a good or product that is shipped out or sold outside of the country. It’s good to know these terms. Let’s take a look at another chart, this represents tariffs on the supply and demand curve:

It may look confusing but it’s actually really simple. Keep in mind that as the supply goes up, the demand goes down. (Price and Quantity go up as well) Also as the demand goes up, the supply goes down. (Price and Quantity go down as well) Now if we at look chart let’s take the green line into account first. The green line is labeled “Supplier’s share of tax”. In order to explain the green line, I will give a brief example:
So let’s say there is a Steel Maker company and a Railroad Tie company. The Steel Company makes the steel that is needed for the Railroad Tie company. There is also a third foreign steel company located in China. So pre-tariff on the import of steel, the cost of steel for the Railroad company is .50 cents per pound from the foreign steel company. The Steel Maker company located in America has a price of .60 cents per pound. The green line represents that .50 cents that the Railroad company currently buys it steel at.
Now lets look at the red line labeled Customer’s share of tax. Back to our example: President Trump has imposed a 15 cent per pound tariff on imported Steel from China. (Not real, just made it up) How does this affect our three companies? First let me give one key detail: Railroad company sells rail ties for 25 dollars per tie. So here is the breakdown of before and after the tariff
Company: Pre-Tariff Price Post Tariff Price Net Change
Railroad company Ties 25 dollars 30 dollars 5 dollars
USA Steel Company: .60 cents .60 cents No change
China Foreign Steel Co. .50 cents .65 cents 15 cents
What happened? Well the Railroad company rose it price by 5 dollars. They also switch suppliers since they don’t want to pay more than they have to for steel. Now refer back to the chart. The distance from the green to red line is known as “dead-weight”. In the chart, the blue triangle in the middle represents the dead-weight. Remember that “customer value” represents the demand side. Also that the green and red lines both represent supply both before and after the tariff is applied. The term dead weight refers the money lost due to the tariff. The Railroad company had to pass its extra cost of 10 cents to its customers. The reason? The tariff made the foreign steel more expensive, however the American made steel did not get any cheaper so therefore the Railroad company had to pass that 10 cent per pound difference to the customer. Of course, depending on the well-being of the company it could have also led to job-cuts or reduction assets.
Conclusion:
To recap: Tariffs create dead-weight whereby the tax increases the cheaper foreign competitor above the already more expensive domestic price. The unnatural increase creates a dead-weight because instead of natural competition, the tariff forces a company to spend more without getting any benefits.
I’m end it here because they will be a part 2. In Part 2 we will finish up with a discussion of President Trump’s policies and the impact it will have with China. Then I will continue to explain some monetary economics that are important to understand.
Thanks for reading!
Check out my social media!
Facebook: Garrett’s Life Experience’s Blog
Twitter: @gpslife12
Have an amazing day!
Featured Image Credit: https://www.tutor2u.net/economics/blog/great-supply-and-demand-starter-cartoons

